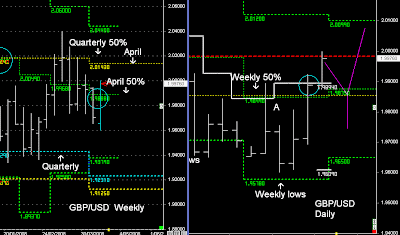
GBP is now trading above the April 50% level and looks to headed back towards the Quarterly 50% level once again.
GBP has just had a higher Weekly close, and it's a close above the 3-day highs.
Therefore Higher weekly open next Week, and the expectation is that price will reverse back down and move into a 2-day stall reversal pattern before any new UP trend occurs.
A 2 day reversal pattern can remain trading above the Weekly and April 50% levels and consolidate, or it can head all the way back towards the 3-day lows.
A 2-day reversal pattern has a random length, and there is a large gap to the 3-day lows, so traders can't discount that happening....
 On Thursday there was a breakout of the 3-day high and the expectation is that price would move up on Friday and then head back down or consolidate above Thursday's 3-day breakout price.
Even though i'm looking for a reversal down next week, certain variables need to align for that to happen.
Support remains @ 1.9817, if price comes down into this level early next week, then the expectation price is moving upwards into Monday's highs.
Price needs to move as high as 2.0035, for the support to shift higher into 1.9999.
If that happens then it's much easier to judge any reversal back down using 1.9999 as a 'support break' and look for a 43 pip spiral top to confirm the rejection pattern under 1.9999


