FOREX EUR/USD Weekly 1st June 2008


EUR/USD Weekly and Daily chart

Last week was a 4th Week reversal pattern after a 3-week UP move, as previously mentioned in last Week’s Report.

Now price is trading at a very important level in any trend:- the Monthly 50% level. These levels are where new trends develop as price ‘thrust’ away from, and by the look of the price action the EURO looks to be reversing back down towards the June lows…


EURO Daily and intra-day charts.

Last Week’s expectation was price was reversing back down into the Weekly 50% level and then lower into Thursday’s 3-day lows. However the 3-day lows didn’t hold which verified the 4th Week reversal pattern.

With any breakout of the 3-day pattern, price will normally come back and test the break zone before it continues with the Weekly trend, and that’s what occur on Friday.

In conclusion:- the only view I have is based on the price action in front of me, which suggests a test and reject pattern on Friday which aligns with the June 50% level will more than likely send prices down…

As long as price remains below the 5-day 50% level then I don’t have any view other than price is moving towards the 3-day lows next week, and could continue down toqards June's lows.

Note:- Ideal short pattern is also a retest of the 2-day highs on the 3rd day and sell-off from a higher Daily open

FOREX GBP/USD Weekly 1st June 2008


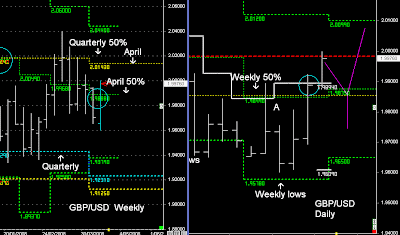
GBP/USD Weekly and Daily chart

At this stage GBP is stilled view with a ‘downward’ bias whilst it’s trading below the Monthly 50% levels.

Until GBP breaks the Weekly highs and comes down to Re-test the June 50% level (verify the break with Monthly 50% level Support) then I would still continue to use the 3-day high pattern as ‘shorting’ opportunities....


GBP daily and Spiral Filter

However on Monday, with price trading above the break of 1.9803, then expectation is price is pushing up towards 1.9865….


  • Daily Trading Set-ups & Analysis
  • Index Futures SPI, DOW S&P, & Forex
  • Subscribe to the Trader Premium
  • http://www.datafeeds.com.au/premiumtrader.html


  • FOREX AUD/USD Weekly 1st June 2008


    AUD/USD Weekly Daily

    AUD trending up towards 97+, and with the MAY high resistance levels shifting higher then there is more room to move higher in June, as long as price remains above the Weekly 50% level.


    AUD intra-day and Spiral pattern

    Last Week was a tight sideways 5-day pattern with a downward bias because of the MAY highs….

    Even though the expectation with JUNE levels shifting higher and price trading above the Weekly 50% levels, I would look for a push down into the Weekly 50% levels, and then look for a break of the Spiral filter to trade ‘longs’ and verify a breakout in the 3-day pattern....

    Because without a breakout of the 3-day highs, then traders need to keep in mind that price can come down and test the June 50% levels .9142 cents....

    FOREX EUR/USD 30th MAY 2008

    "Whenever there is a higher open in the Weekly timeframe, there is an expectation of a 2-day pullback towards the Weekly 50% level before and new UP trend develops.

    If the UP trend continues then it should find support around the Weekly 50% level and continue higher by Friday....

    Note: Weekly cycle is a SELL, there has been a bias to Rise UPwards for the past 3-weeks. Because the cycle is a SELL, traders need to keep in mind that a 4th Week can reverse downwards.

    This will be confirmed with a break of the 3-day lows and matching Weekly 50% level :- 4th Weekly lower close by Friday.


    (Weekly Report 26th MAY 2008)


    EUR/USD Weekly & Daily charts

    Expectation this week was that the EUR would move into a counter-trend move back towards the Weekly 50% level.

    This Weekly 50% level was the critical level on the direction of the EURO this week, because a failure on the 4th Week would push prices lower by Friday (unless news on Friday 'spikes' the Euro)

    Friday is the last day of the month, and today's price action is going to define the early direction next month, because the June 50% level is going to direct trend for the next 4 weeks, along with the 5-day pattern.

    EUR Daily and 5-day

    Expectation was that price would push lower into Thursday's 5-day lows, if the EURO was going to continue higher then these levels would hold and then rotate upwards by Friday.

    Thursday's 5-day lows didn't hold, and now the expectation is that a test of the 3-day high on Friday and expectation price is going to continue down.....

    FOREX EUR/USD 29th MAY 2008 part 2


    EUR Daily and 5-day pattern

    EUR has pushed down into the lows on Thursday:- breakout on Wednesday....

    A supported currency would be reversing off these lows and rotating back towards Yesterday's break and consolidate into Friday....

    Don't trade longs below the Thursday's 5-day lows, as per Weekly Report

    FOREX EUR/USD 29th MAY 2008

    EUR/USD Daily and 5-day pattern chart

    Two 2 days ago I was looking for a rotation back towards the Weekly 50% level.

    Whenever the Weekly timeframe opens higher, the expectation is a 2-day pullback into the Trailing support levels.

    If the Euro is going to continue higher then the expectation is that the Weekly 50% level should hold, but probably won't continue higher until next week, when prices rise upwards off the June 50% level and continues towards June's high.

    Day trading:- A break of the 5-day lows, and expectation price will normally move towards the 5-day lows in the next day....

    Two plays.....

    A:- pushes up early on Thursday and continues down into the 5-day lows on Thursday...

    B:- remains below Wednesday's 5-day breakout and continues down into the 5-day lows, before swinging back towards the 5-day 50% level....

    Next two days I'm expecting a 2-day sideways move and then define the next stage of the trend from the month of June .

    Don't short trade the break of Thursday's 3-day high :- A test of the Weekly 50% level in the first 3-days of the Week can often see buying come back in. Even though i'm factoring in two days of sideways price action until the end of the month, trader's shouldn't fight the trend after a bounce off the Weekly 50% level.

    Note:- Bearish pattern would be a continuation down into the 5-day lows on Thursday, and then Friday continues down into a lower Weekly close, as previously mentioned on the 26th May.

    This pattern could then have a rejection sell-off next week from the June 50% level, but at this stage that's not part of the overall view. If that starts to play out it won't be until next week....

    FOREX AUD/USD 27th MAY 2008

    AUD rising wedge, and currently supported above the 5-day 50% level....

    I still have the view on the AUD/USD spread as per the Weekly Report on the 24th May....

    Monday was a flat trading day, but with price still coming down from the spiral filter tops, then expectation still remains that the 90-95 pip range should complete downward:- after 41 pip exit run stops above the spiral highs...

    Shift in levels on Tuesday, if Tuesday continues to find support above the 5-day 50% level and breaks .9626 then price will probably push up towards the 5-day highs.....

    FOREX EUR/USD 27th MAY 2008

    EUR Daily and 5-day chart....

    EUR pushing up towards the Weekly highs, but Ideally I would like to see price move down towards the Weekly 50% level before any UP trend continues this week.

    There is a converagance of the 3-day pattern, therefore there is going to be a breakout either way today...

    The levels will be confirmed midnight GMT time, but if price is trading above the Yellow 3-day channel then the bias is to move higher on Tuesday....


    Yesterday's expectation was that price was coming down from the 90 pip top and would begin to push down on Monday.....

    However the push only lasted 43 pips, which 41 pips is the normal partial exit strategy when trading.....

    Simply define Tuesday's trading by the Spiral risk filter: below and it's move down to complete the 90 pip range and hopefully continue down....

    Above and expectation price will moving towards the 5-day highs......

    FOREX EUR/USD 26th MAY 2008

    EUR Weekly and Daily charts

    EUR looks to be pushing up into 1.6019.

    It has bounced off the MAY 50% level and a breakout of the Weekly highs, with this week's expectation to push up towards 1.5884.

    However, whenever there is a higher open in the Weekly timeframe, there is an expectation of a 2-day pullback towards the Weekly 50% level before and new UP trend develops.

    If the UP trend continues then it should find support around the Weekly 50% level and continue higher by Friday....

    Note: Weekly cycle is a SELL, there has been a bias to Risk UPwards for the past 3-weeks. Because the cycle is a SELL, traders need to keep in mind that a 4th Week can reverse downwards.

    This will be confirmed with a break of the 3-day lows and matching Weekly 50% level :- 4th Weekly lower close by Friday.

    Intraday price action on Eur:- favours 90 pip completion downward, when it's reversing down from the Spiral filter....

    Matching 3-day lows and 5-day 50% level....which in a normal UP trend would hold and continue higher.

    In a 'starting' reversal downtrend :- would break and then price would continue downward the following day....

    FOREX GBP/USD Weekly 24th May 2008

    Previous Weekly Report....

    "Early next week the expectation is price is pushing upwards towards the 3-day high and reversing back down into the 'Breakout' :- Support...

    The breakout on Friday will probably be valid for 1 day and push back upwards on Tuesday......

    The Weekly 50% level is the trend guide in MAY, therefore if Price is going to re-test the lows again then price should begin to move down on Wednesday, using the 3-day high pattern technique....

    If these lows last Week are valid support zones then, price should be moving above the Weekly 50% level on Wednesday and heading back towards the MAY 50% level."


    GBP/USD daily chart

    Weekly 50% Breakout and push up into the MAY 50% level.....


    GBP started off to the letter:- pushing up into Monday's high, reversal down into the 5-day 50% level and pushing back up on Tuesday towards the highs...

    Tuesday break out, and as per Premium Report on Wednesday.......

    Wednesday to test the 3-day break of Tuesday @ 1.9615 and then continue higher all week...

    Next week:- expected Resistance around the MAY 50% level and Weekly highs, but I won't have a clear view until the of the Month and analysis GBP using June's Monthly levels....

    All Daily analysis and trading set-ups :- Day trading and swing trading are found in the Premium trader...(Index Futures included)


    http://www.datafeeds.com.au/premiumtrader.html

    FOREX AUD/USD 24th MAY 2008


    AUD Weekly and Daily chart...

    AUD trading around the Monthly and Weekly highs, and has moved into a consolidation pattern.

    Next week those Weekly highs shift upwards, which goes close to matching the April-June Quarterly highs...

    As a trader I personally don't want to be trying to trade 'long' positions around these highs, instead looking for reveral patterns in the market....


    AUD 5-day charts and Range bar 'Spiral Points'

    This week price tested the 3-day lows from the spiral tops, and on Friday the AUD has the same pattern....

    The sign of a 'short-term' reversal pattern will be a break of the 3-day lows.....and then look for a contination into the Weekly 50% level

    With Friday pushing down from a spiral top:- 95 pip reversal will put it below the 5-day 50% level:- but that that 95 pip completion will be verified on Monday....

    As long as i'm using the Spiral filter and taking a partial exit @ 41 pips then the rest of the trade is easily manageable....

    FOREX GBP/USD Weekly 17th May 2008

    GBP Weekly and Daily chart

    Expectation the Month of MAY was pushing down from the 50% level towards the MAY's low, with each Weekly Low providing swings towards the Weekly 50% level in each week, and then each 5-day pattern continues down.

    This week has gone close to the lows, and next Week price will already be trading around the Weekly 50% level......

    GBP:- Early next week the expectation is price is pushing upwards towards the 3-day high and reversing back down into the 'Breakout' :- Support...

    The breakout on Friday will probably be valid for 1 day and push back upwards on Tuesday......

    The Weekly 50% level is the trend guide in MAY, therefore if Price is going to re-test the lows again then price should begin to move down on Wednesday, using the 3-day high pattern technique....

    If these lows last Week are valid support zones then, price should be moving above the Weekly 50% level on Wednesday and heading back towards the MAY 50% level.

    All Daily analysis and trading set-ups :- Day trading and swing trading are found in the Premium trader...(Index Futures included)

    http://www.datafeeds.com.au/premiumtrader.html

    FOREX AUD/USD Weekly 17th MAY 2008

    AUD Week and Daily chart

    AUD bounced off MAY 50% levels once again and now pushing up into MAY's highs this Month.

    As pointed out the Premium Trader, the Quarterly timeframe has forward 'drops', which is a forewarning pattern of weaker prices. However, Quarterly timeframe is 3-months in length and any weaker pattern can happen any time during these current 3-months, with a few confirming patterns along the way.

    This week on the AUD saw the first confirming SELL pattern with Thursday's break of the Weekly 50% level, price moved back down into the MAY 50% level:- support.

    The 2nd part of the Weaker pattern was based on Thursday's price action and an 'UP' day:- test Weekly 50% level on Thursday, and Reject down on Friday......

    AUD 3-day Chart

    As we can see Thursday closed back above the Weeky 50% level, which already puts the 'Reject' pattern at a failure, and if price isn't trading below the 5-day 50% level on Friday, then there is no 2nd confirming pattern for confirming Weakness.

    Friday breakout in the 3-day pattern and rally back towards the Weekly highs...

    Next Week:- AUD pushing up into MAy's highs, and at this stage it's pushing up towards the Quarterly April-June highs.

    Short-term:- Expectation price will push higher on Monday and come back and test the 5-day 50% level. If prices are going to continue higher, it should bounce of the 5-day 50% level and be trading around it's highs on Tuesday....

    Note: There is still the 'Drop' in the Quarterly timeframe and this will be hanging over it's head and i'll be looking for any 'Sell' patterns in the market using the 3-day high pattern

    FOREX AUD/USD Weekly 15th MAY 2008

    AUD Weekly chart

    UP Trend in price....

    However....'Drops' in forward Quarterly timeframe is forewarning weaker patterns ahead...

    First sign this week has been the break of the Weekly 50% timeframe.....

    Confirming pattern will be a break of the MAY 50% level....

    Price action to keep an eye on would be an UP day today :- test Weekly 50% level...

    And a higher open next day and price begins to SELL down:- test and reject pattern...

    FOREX GBP/USD 10th MAY 2008

    GBP Weekly and Daily charts

    GBP pushing down into the MAY lows.

    Last Week closed on it's lows and below the Weekly channel lows:- breakout can just send GBP lower into next week's lows....

    Ideally the best set-up would be a 2-day swing upwards early next week and into the Weekly 50% level, and then continuing down towards MAY's lows

    3-day lows support on Friday....

    And if there is going to be a swing up towards the 3-day highs early next week, it should be trading above 1.9566

    Otherwise it will continue to make lower lows each day.....

    FOREX GBP/USD 3rd MAY 2008

    GBP Weekly and daily charts

    Large triangle formation occuring with expectation that GBP will move lower in MAY towards the Quarterly lows.

    This week we have seen prices swing back upwards and test the MAY 50% level, before selling off, with the expectation that prices will make a lower low next week.

    GBP Daily and 5-day pattern

    As illustrated above:- 3-day rejection pattern into lows


    GBP 5-day pattern

    Support as shown around the Risk levels on Monday, which will probalby push price back up into the 3-day rejection pattern.

    Below Risk and it's a breakout confirming the move down into the 5-day lows.

    Note: lower Weekly close followed by a lower Weekly open next week, therefore there is an expectation that a 2-day counter-trend move can occur, which will probably be around the Weekly lows :- ie Lower Daily close and then rising UP from a lower Daily open.

    FOREX GBP/USD 26th April 2008

    Weekly Report....

    GBP/USD Daily chart

    GBP/USD remains range bound between the Weekly levels, and consolidating either side of the April 50% level until the new Month of May begins.

    At this stage Traders have to keep on trading the rotation of the market within the 5-day ranges, until a weekly Range breaks.

    Friday's view was once price was above 1.9753 the expected move was back towards the 5-day 50% level from Thursday @ 1.9854.

    Next weeks' view is more of the same, normally I can get a could idea about an early probability pattern for Monday, but with price trading in the middle of the higher timeframe 50% levels, it can go either way.

    However, I would view the market coming back down and re-testing the Risk level at this stage, even though it's trading above the 5-day 50% level.

    Use the levels as shown in the left chart...

    FOREX GBP/USD 19th April 2008

    GBP Weekly and Daily Charts

    GBP is now trading above the April 50% level and looks to headed back towards the Quarterly 50% level once again.

    GBP has just had a higher Weekly close, and it's a close above the 3-day highs.

    Therefore Higher weekly open next Week, and the expectation is that price will reverse back down and move into a 2-day stall reversal pattern before any new UP trend occurs.

    A 2 day reversal pattern can remain trading above the Weekly and April 50% levels and consolidate, or it can head all the way back towards the 3-day lows.

    A 2-day reversal pattern has a random length, and there is a large gap to the 3-day lows, so traders can't discount that happening....

    On Thursday there was a breakout of the 3-day high and the expectation is that price would move up on Friday and then head back down or consolidate above Thursday's 3-day breakout price.

    Even though i'm looking for a reversal down next week, certain variables need to align for that to happen.

    Support remains @ 1.9817, if price comes down into this level early next week, then the expectation price is moving upwards into Monday's highs.

    Price needs to move as high as 2.0035, for the support to shift higher into 1.9999.

    If that happens then it's much easier to judge any reversal back down using 1.9999 as a 'support break' and look for a 43 pip spiral top to confirm the rejection pattern under 1.9999

    FOREX GBP/USD 12 April 2008

    GBP Weekly and Daily charts

    At this stage the view is for GBP to head down towards the April low.

    However things don't go down in straight lines, they often zig-zag their way to larger timeframe levels.

    3 plays that we need to look out for next week....

    A:- and this is what I would like to happen...

    A lower Weekly open and expectation that price will swing back up into the Weekly 50% level before heading down into the Weekly lows

    B:- Weekly channel lows shift lower next week and price moves down into the Weekly lows before reversing upwards into the Weekly 50% level and the 3-day highs.

    C:- Just continues down on Monday and breaks support early in the Week and moves into a trend Weekly timeframe down. (less likely)

    The 5-day 50% level has been defining the trend with each day pushing lower.

    If the market is going to follow either A set-up or B-set up then next week price will have to break the 5-day 50% level.

    FOREX GBP/USD 4th April 2008

    GBP Weekly and Daily charts

    This week we were looking for a rotation back upwards into the April Balance Point and Weekly 50% level.

    This was completed on Friday, and GBP was pushed back down into the close.

    The Weekly timeframe from March has ended and now GBP is trading in the middle of major timeframe looking to 'thrust' back out to the outside Monthly channels.

    But at this stage it's too early to tell the direction of whether that will be UP in April, or Down.

    A bounce off the April 50% level early next week and move above the Weekly 50% level will favour a move higher.


    GBP intra-day...

    As the previous report suggest, I was looking for a move higher on Friday towards the 5-day highs, which matched the Weekly 50% level, but I also was looking for a reversal back down into the 5-day 50% level...

    This played out.

    Early next week, traders need to trade on the side of the 5-day 50% level, because last week there was no breakout of the 3-day highs, it was simply moving with the ranges each day...

    Daily Report next Week....

    FOREX GBP/USD 1st April 2008

    GBP/USD Weekly and Daily charts

    The start of the new Quarter and Trading month, and Yesterday's trading has pushed the April 50% level down to 1.9885.

    Whilst price is below this level, price pushing down into the Weekly .618 lows @ 1.9694

    Above 1.9885 and it's moving back towards the Weekly 50% level.

    At this stage Price is trading below every timeframe 50% level

    Note:- the Weekly timeframe still remains trading in the previous Quarter and won't be confirmed until the end of this week.


    GBP intra-day

    It looks like GBP is pusing down into the 3-day lows again on Tuesday.

    An UP move will obviously rise up from the April 50% levels, but intra-day trend is going to be defined by the RISK level on any higher moves, whilst the support levels are only factoring 43 pips moves.

    So around 1.9756 expectation support will play out and rise 1-2 43 pips, but above the risk level will confirm that price is moving back up into the Weekly 50% level.